Indicators & charting tools
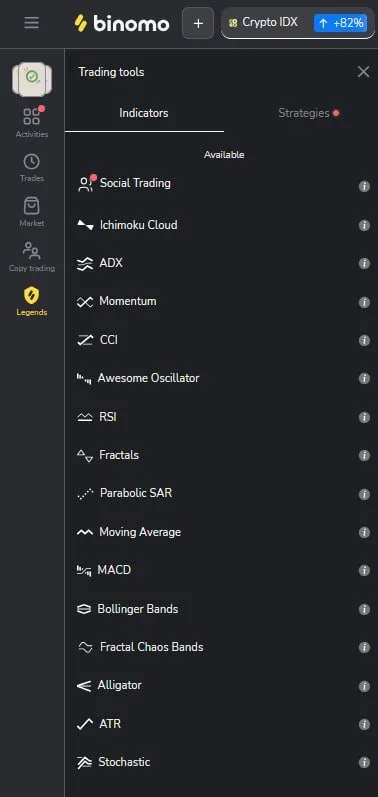
Binomo's charting terminal comes with technical indicators, a range of chart types, and drawing tools to back up your analysis. Among the indicators seen on the platform are: Moving Average, RSI, MACD, Bollinger Bands, Stochastic, ADX, CCI, Momentum, Awesome Oscillator, Parabolic SAR, ATR, Ichimoku Cloud, Fractals, Fractal Chaos Bands, and Alligator. Several can be switched on together (for example, ATR (14) appearing as an active indicator).
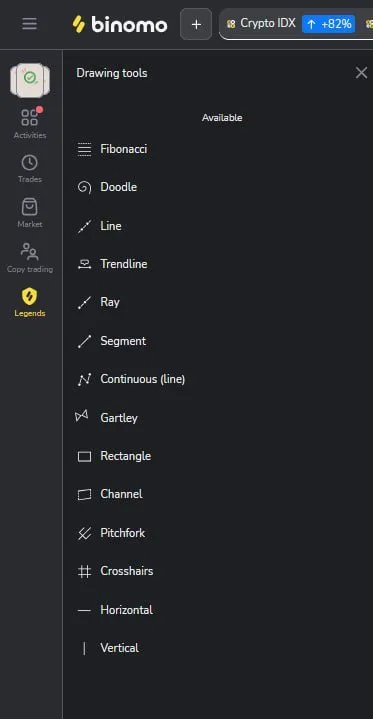
On top of the indicators, you get a choice of chart types — Line, Candlestick, Area, Bars, and Heikin Ashi — alongside drawing tools such as Fibonacci, Trend line, Channel, Gartley, Rectangle, Horizontal/Vertical, and others for marking out levels on the chart.
Keep in mind: indicators and drawing tools are there to assist your analysis, not to serve as magic signals or a promise of profit. Piling on indicator after indicator won't turn a prediction into a certainty, and in high-risk fixed-time trading, yesterday's patterns are no assurance of tomorrow's outcomes. Learn to read each indicator and try them out on the demo before you commit real money.
Available on the chart
Observed in Binomo's chart terminal — the exact set can change over time.
Indicators
Chart types
Drawing tools
Indicators are analysis aids, not magic signals. Stacking more of them doesn't make a prediction certain — on high-risk fixed-time trading, past patterns don't guarantee future results.